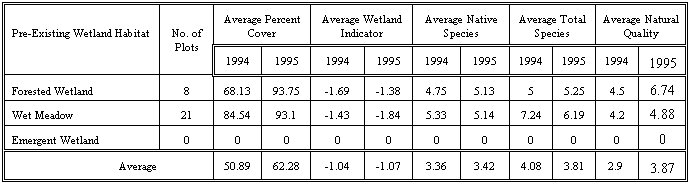
| Table 2. Vegetation monitoring data from pre-existing wetlands (excluding 3L wetlands) in Crosswinds Marsh.* |
 |
Donald L. Tilton, Tilton & Associates, Inc.
Introduction and History
In 1992, the Wayne County Detroit Metropolitan Airport filled wetlands in order to expand the runway complex at the airport. As a requirement for filling the wetlands, the airport created and restored approximately 162 ha (400 acres) of wetland habitat at a site located 24 km (15 miles) southwest of the airport (i.e., Crosswinds Marsh).
Objectives
The objective of this project was to re-establish wetland values and functions lost due to airport expansion by restoring and creating wetlands. Wetland habitat to be restored and created included submergent, emergent, scrub-shrub, and forested areas. Primary wetland functions and values that were to be created were fish and wildlife habitat, water quality improvement, flood storage, and passive recreation.
Characteristics
An environmental impact statement was prepared for the expansion of the airport. This laid the foundation for project design, including a revegetation program which complemented the local gene pool, increased plant diversity, and controlled invasive species. In addition, existing habitats were conserved and new habitats created for endangered and threatened species, and species of special concern. Fish and wildlife habitats were interspersed throughout the site. Stormwater storage was accomplished through the use of passive low-maintenance retention structures. A system of shallow wetlands was designed to remove pollutants from runoff.
Actions
The wetlands were created by altering the drainage profile of existing drains and rerouting flow from within the subwatershed to create hydrological conditions suitable for wetland establishment. A combination of treatments was used to create wetlands, with some areas being planted and seeded, and other areas allowed to colonize naturally by wetland plant species. In addition to different seeding treatments, some wetland areas received new topsoil, some had a surface application of sand, and some were undisturbed. Monitoring of vegetation, hydrology, and wildlife habitat development has occurred on an annual basis. New and restored wetlands were compared to existing wetlands that were retained on the project site as reference wetlands.
Effectiveness and Further Steps
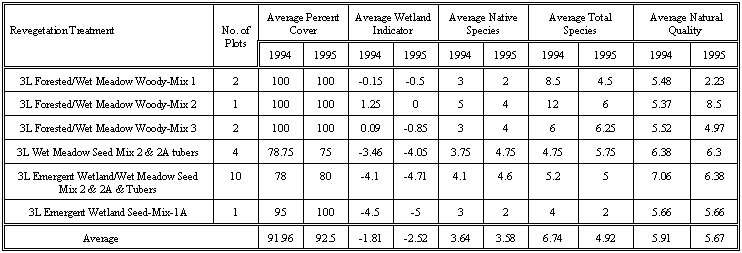
Wetland hydrology of the area has developed in accordance with the model predictions. Wetland hydrological conditions (saturated or ponded soil) were observed at all wetland locations. Wetland vegetation has developed successfully, with 80% plant cover by wetland species in all new or restored wetland areas within two years of completing construction (Tables 2-4).
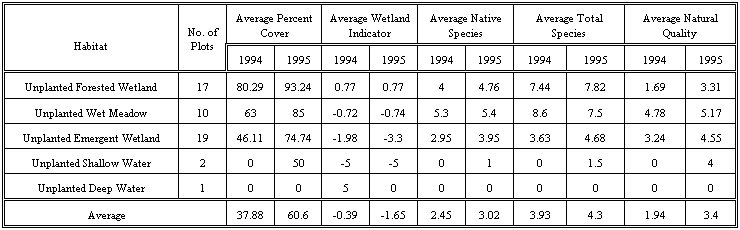
Unplanted wetlands areas developed in a similar fashion compared to planted wetlands with similar percent cover, number of native species, and total number of species. In monitoring the wetlands, a measure of the natural quality of vegetation was developed in order to characterize the relative dominance of non-native plant species. Unplanted wetlands tended to have similar numbers of non-native species compared to natural or planted wetland areas. Wildlife species observed at Crosswinds Marsh include seven species of amphibians and 52 species of birds, most notable of which is a pair of bald eagles which are frequently observed at the site.
| Table 2. Vegetation monitoring data from pre-existing wetlands (excluding 3L wetlands) in Crosswinds Marsh.* |
|
* 3L refers to replacement wetlands for the 3L runway extension project. Average wetland indicator refers to numeric values assigned to the rating assigned plant species in the National List of Plant Species that occur in wetlands. The rankings range from obligate wetland plants (-5) to wetland plants (5). A site with an average wetland Natural Quality indicator of less than one is considered dominated by wetland vegetation. Average Natural Quality was calculated by summing the coefficients of conservatism of an inventory of all plant species in each habitat, dividing by the total number of plant species, and multiplying by the square root of the total number of plant species. The average natural quality is based on the Floristic Quality Assessment developed by Michigan Department of Natural Resources. The average number of species refers to the number of species per square meter.
| Table 3. Results of different planting mixes in 3L wetlands in Crosswinds Marsh. |
 |
| Table 4. Vegetation monitoring data from unplanted created wetlands (excluding plots from 3L and pre-existing wetlands) in Crosswinds Marsh. |
 |